
Figure 1. Number of Active Student per Batch Year

The graph above shows the number of active students per batch from 2019 to 2022. The graph shows ups and downs from year to year.
Figure 2. Number of Students Achievement (Last 3 Years)

The graph above illustrates the number of student achievements from 2019 to 2020. The graph shows a significant decrease in 2020, this could be due to the start of the pandemic in 2020. However, there has been an increase in the number of achievements in 2022 nationally and internationally.
Figure 3. Number of Applicants Between Selection Path (SNMPTN, SBMPTN, Mandiri)
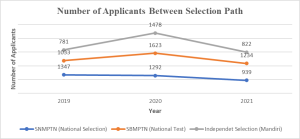
The graph above shows the number of prospective students who have registered in the 3 available pathways, SNMPTN, SBMPTN, and Mandiri. It can be concluded that there has been a decrease in the number of prospective students enrolling in 2021 for each track.
Figure 4. Competitiveness Between Selection Path (Last 3 Years)

The graph above shows the level of stringency in the selection of the three available selection pathways in 2019, 2020 and 2021.
Figure 5. New Students and Graduates (Last 3 Years)
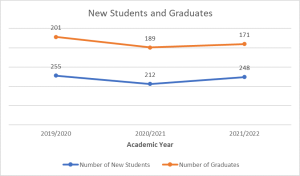
The graph above illustrates the number of students who entered and the number of graduates in the same year. It can be concluded, every year for the difference in the number of students who enter and the number of graduates is not much different.
Figure 6. Average Study Period of 2019 to 2021
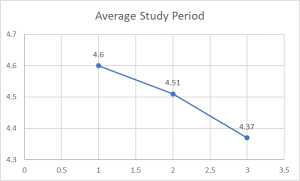
The graph above illustrates the average student study period in 2019, 2020, and 2021. It can be illustrated that there has been a decrease in the average student study period each year, in other words, the study period taken by students is getting faster.


